 Google AdWords and Google Analytics offer a wealth of reporting to help you get the most out of your PPC campaigns, but I am always surprised by the number of reports that don’t always get used.
In this post, I am going to share with you various reports from AdWords and Analytics that everyone running or managing a PPC account should not only be aware of, but should be using on a regular basis.
There are seven reports in my list below; so if you were to take one report per day for a week and really go to town analysing the data, at the end of it, your AdWords campaign should be in a much healthier state than it was before. Of course, if you have the time and you want to run and analyse more than one report in a day you can do, but sometimes I do find that if you really want to go in-depth, it is good to break your reporting down.
Day 1 – Location Report
If you are running a campaign across an entire country, there may be certain counties that don’t perform as well as others. Using the Location Report, you can see how each of the counties have performed for an individual campaign.
Export the report into Excel and apply a filter to segment the data to show you the counties that have driven the lowest number of conversions, the highest Cost per Conversion or the lowest Conversion Rate.
I would always recommend that you look at this data over a long time frame to ensure there are no anomalies. Looking back over the last three to six months of data should be sufficient, but this does depend on how much traffic your AdWords campaign generates.
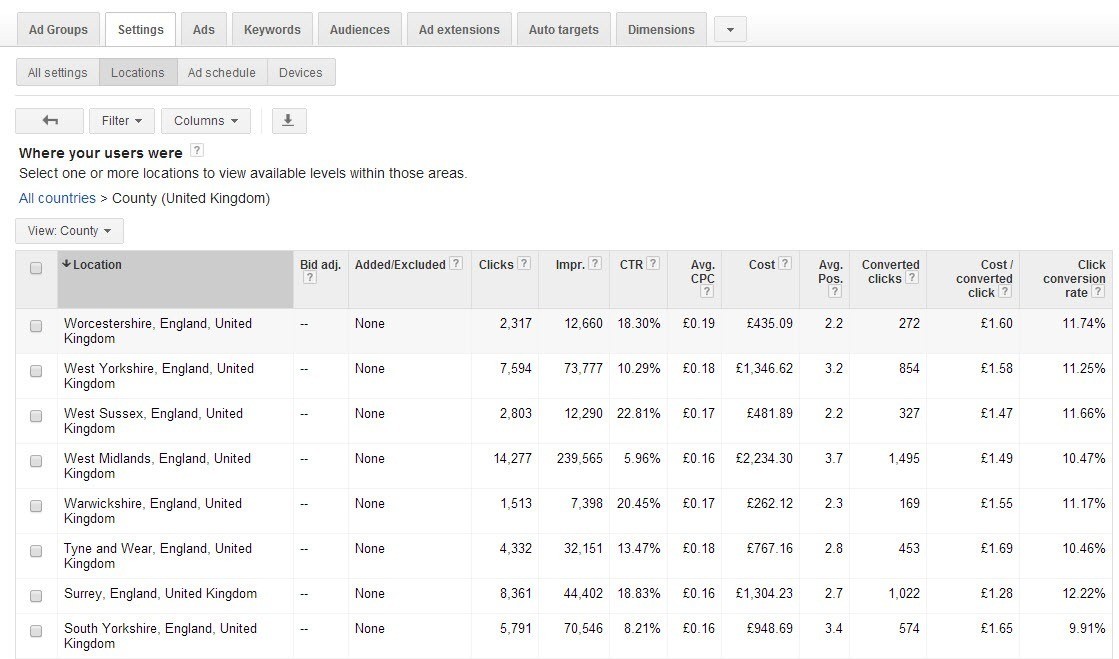
Once you have highlighted counties to exclude, you need to go back to the Location Settings tab and search for each county and exclude them from the targeting list.
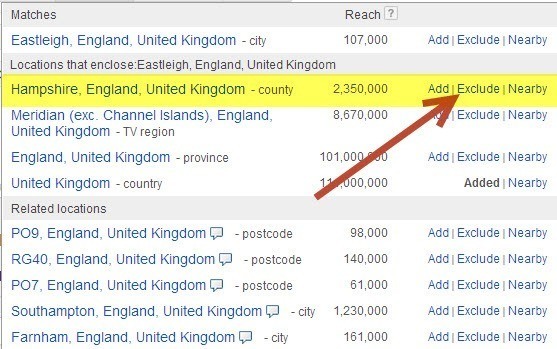
If you want to drill down further and look at filtering the data by other metrics in many countries you can go down as far as City, Town, Post Code etc.
NOTE: These reports only work in certain countries; when you go to use the report, you will be able to see if the report works in your location.
How to find the report
Google AdWords > Campaign Settings > Locations > View Location Reports > Where your users were (user locations) > View County
Day 2 – Day Of The Week
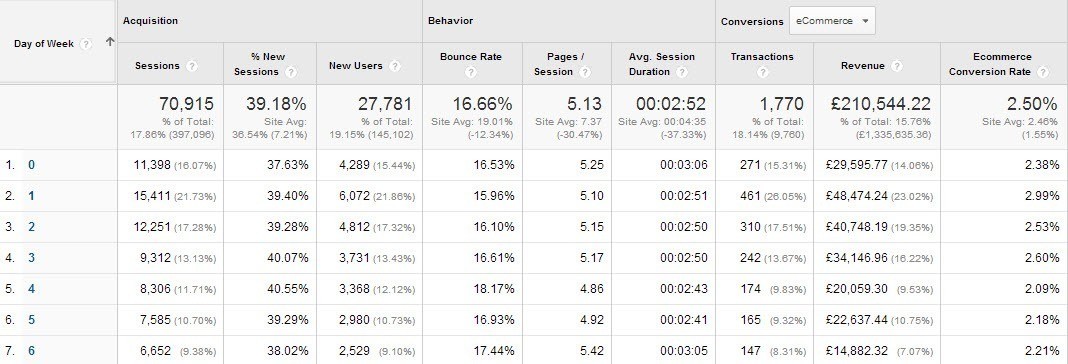
There are two ways of looking at the data to see how the different days of the week convert for you. You can either use the report in Google AdWords or the report in Google Analytics. My personal preference is to use the Google Analytics report as it gives you more information and appears easier to read, but I use both reports for different sets of data.
Analytics Report
AdWords Report
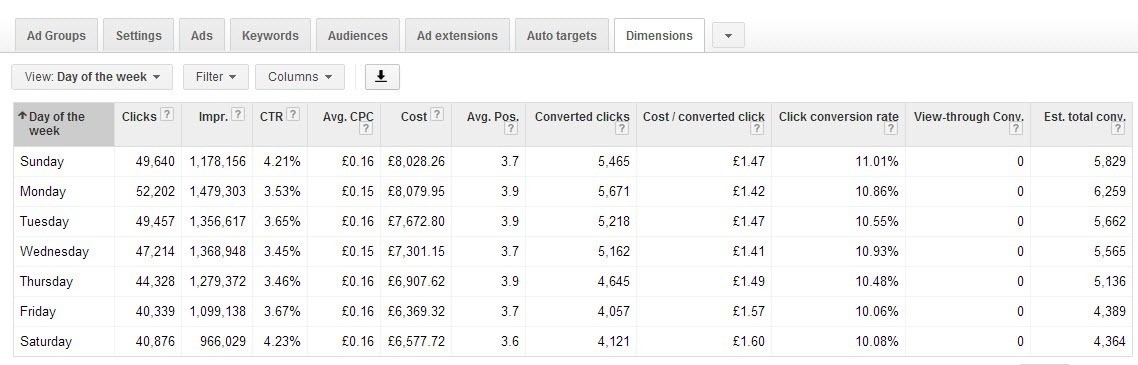
You can use these reports to understand which days of the week perform better than others. It may be that on one day of the week the number of conversions drops off and the Cost per Acquisition (CPA) increases. This will ultimately increase the overall CPA of the campaign. By understanding this data, you can use the Bid Adjustments in Google AdWords to lower how much you are bidding for keywords on that particular day or if the results are really poor, you may decide to pause the campaign on that day altogether.
If we look at this in the reverse, there may also be a day that is out performing all the others – take advantage of this by increasing your bid prices for that day to drive more traffic to the site – this should transpire into more conversions. Obviously, if this is something you set up you will want to monitor the performance to ensure conversion numbers increase.
Note: In Google Analytics (not including my custom report), for some reason the days of the week are shown as numbers, with 0 being Sunday and 6 being Saturday.
How to find the reports
Google AdWords > Campaign > Dimensions > View > Time > Day of the Week
Google Analytics > Acquisition > AdWords > Hour of the Day > Day of Week
I have also set up a Custom Report that allows you to see a lot more data within the one report.
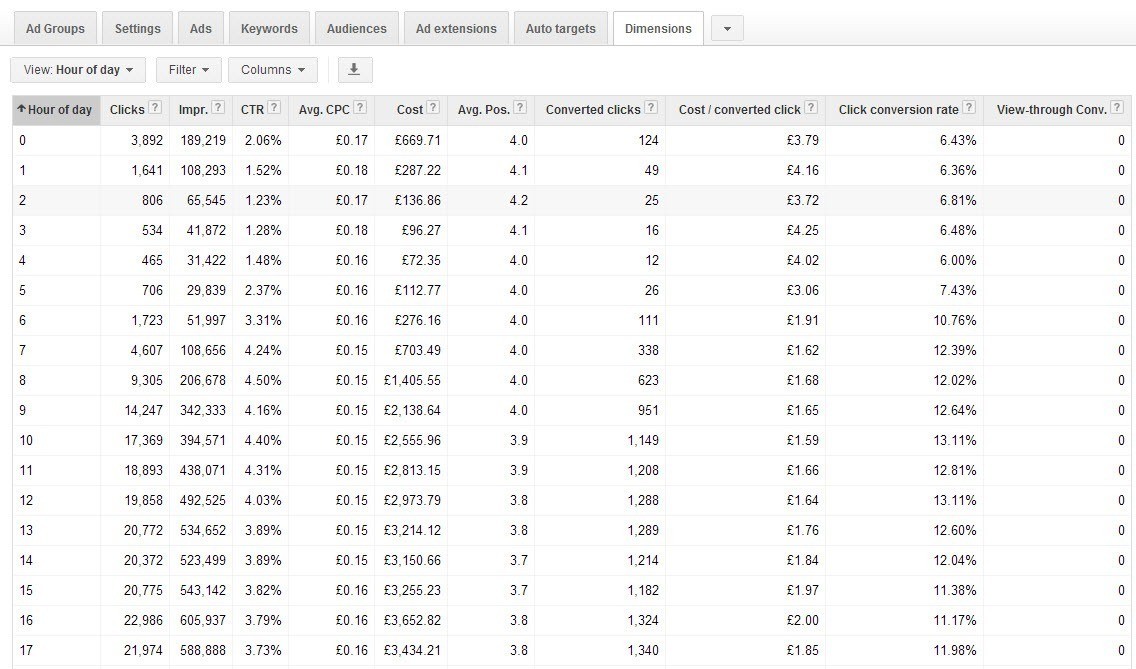
Day 3 – Hour Of The Day
As with the day of the week reporting, there are also two different reports for analysing performance by hour of the day. I would recommend that you use the report in Google AdWords for this analysis as it is much easier to understand the data.
Combining this with the day of the week report, you can really get to grips with how your campaigns are performing throughout the course of a day. Rather than simply making decisions to pause campaigns or lower the bids for campaigns on entire days, you can drill down to see which times of the day are actually performing the worst and adjust the bids down for those time periods instead of across the board.
How to find the reports
Google AdWords > Campaign > Dimensions > View > Time > Hour of Day
Google Analytics > Acquisition > AdWords > Hour of the Day
Day 4 – Search Query Report
The Search Query Report has been around for a long time in many different formats. If you are not using this on a regular basis, you are missing out on seriously optimising your account.
I use this report for two different things:
- To uncover new keywords that are driving traffic on my ads that I am not targeting
- To uncover irrelevant keywords that I can add as negatives to the campaign
Depending on how much traffic you get through your AdWords campaign, it is best to use the Search Query Report at least once a week so that you don’t have to spend ages trawling through the data to find what you are looking for. The more often you use it, the less time you end up spending on it.
You should run the report and look through all the search queries for the phrases that have driven traffic to your site that are completely irrelevant. These should immediately be added as negatives to either the account or campaign depending on what the phrase is. By continuously doing this exercise, you will gradually reduce the amount of budget you are wasting on terms that are not related to what you offer.
Likewise, if you have keywords on phrase or broad match, the Search Query Report will also show you keywords that you may not have in your account that have been driving traffic that converts. If this is the case, you want to make ad groups for those terms with dedicated ad text and landing pages to boost the overall Conversion Rate and conversions for the campaign.
As I mentioned above, this is a continuous exercise that needs to be done frequently in order to have a benefit. If you are managing an account for someone else and you haven’t worked on it before, this report should be one of the first places you look to see how well optimised the account is.
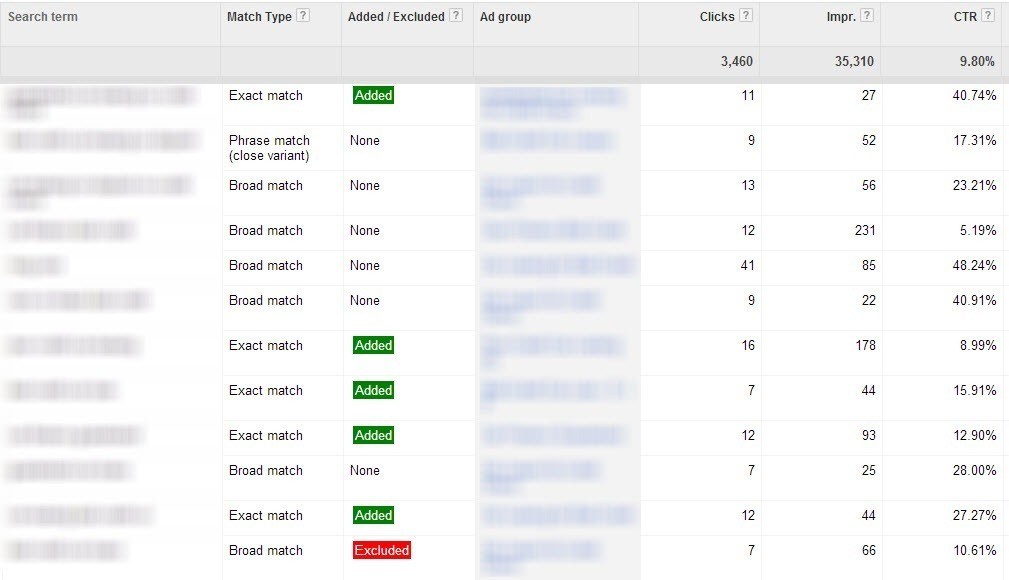
Note: In the report you can see whether or not you have added or excluded a keyword so you don’t have to look through all the keywords, just use the ones without a green or red banner next to them.
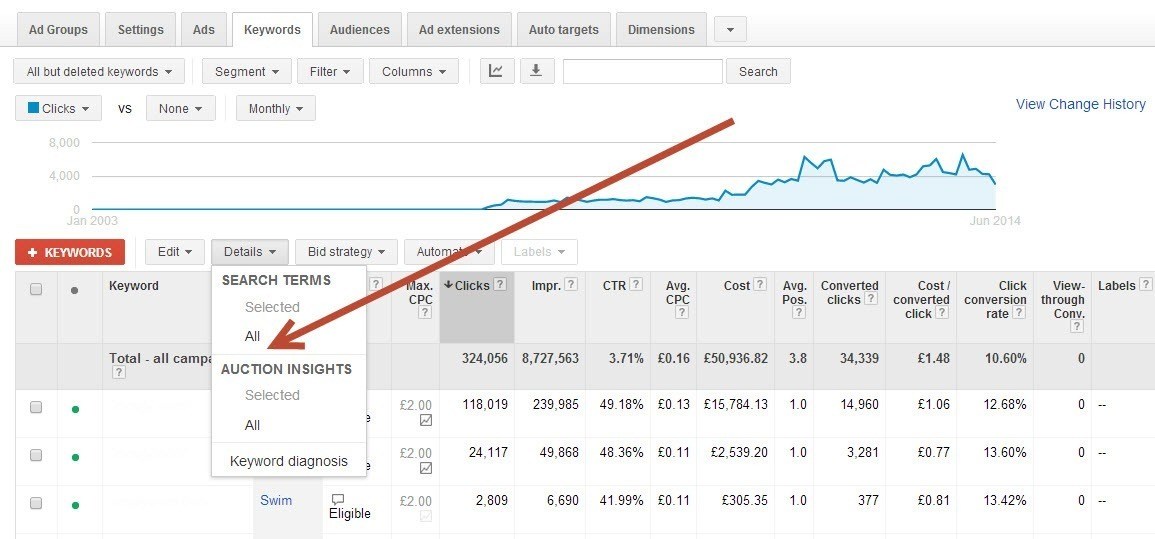
How to find the report
Google AdWords > Campaign > Keywords > Details > Search Terms > All
Day 5 – Keyword Positions
For your high traffic and most expensive keywords, it is always best to test their performance in different ad positions. You may think that being in position one will drive loads of traffic to the site and in turn, generate loads more conversions but unless you test this, you could be completely wrong.
In fact, I have seen some research in the past that shows being in position one as generating the most traffic out of all positions but this doesn’t always translate into conversions. Position two and three can sometimes return a higher Conversion Rate. This is going to be different for every business though so I would always recommend testing this.
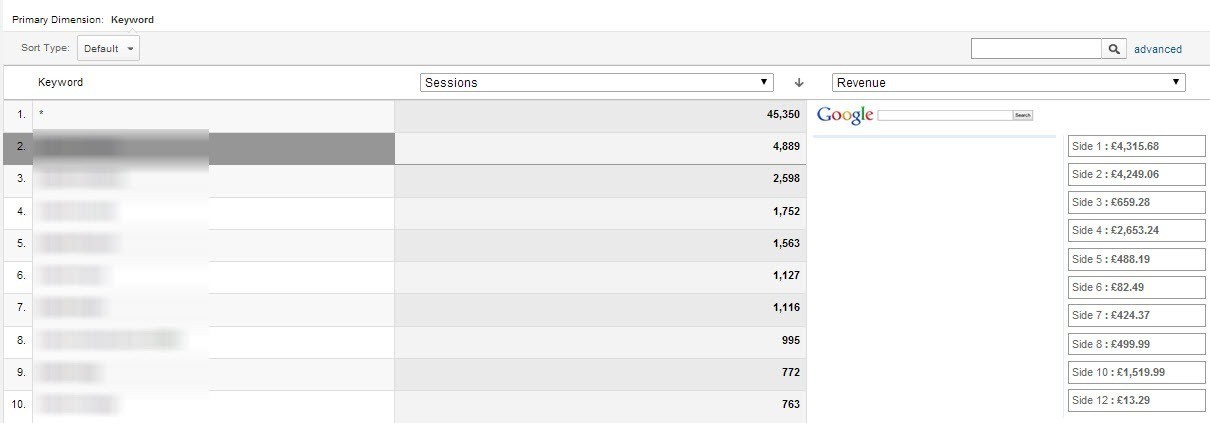
You can use the Keyword Positions report in Google Analytics for this analysis. There are various metrics that you can use for your analysis, but what I like to look at first is the number of visits (sessions) against revenue or conversions generated. The report will show you how well the individual keyword you are looking at has done in the different positions it has been shown. If you see that it is performing better in a certain position, you can adjust your bids to achieve that position more frequently.
Note: Google AdWords used to have a tool where you could specify what position you ideally wanted your ads to appear in but this has now been removed.
How to find the report
Google Analytics > Acquisition > AdWords > Keyword Positions
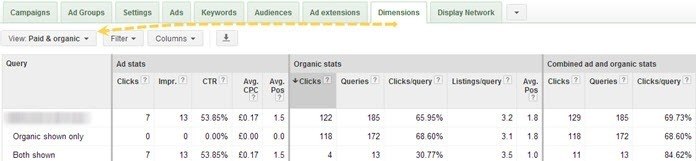
Day 6 – Paid And Organic
To make use of this report, you need to ensure that you have linked Google Webmaster Tools to Google AdWords. If you try to navigate to this report and the two have not been linked, you will not see any data.
When you link the account, be sure to link the www. and the non www. versions of the domain so you can get the maximum amount of data pulled across.
Essentially, what this report does is tell you how your paid search keywords are performing compared to your organic keywords. The number of metrics you can analyse is pretty low in comparison to other paid search reports, but the report is relatively new to AdWords so there is definitely room for improvement.
There are two things that I find this report useful for, in its current format:
- To discover new keywords
- To track position tests
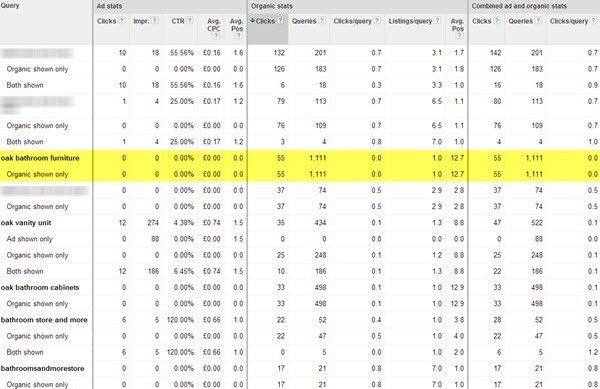
In the example screenshot below, we can see that ‘Oak Bathroom Furniture’ is appearing in the organic listings and is generating a fair amount of traffic at a low average position. You could add this keyword to your PPC campaign to see how it works in a higher position. Without using this report, you could potentially miss keywords that could drive converting traffic.
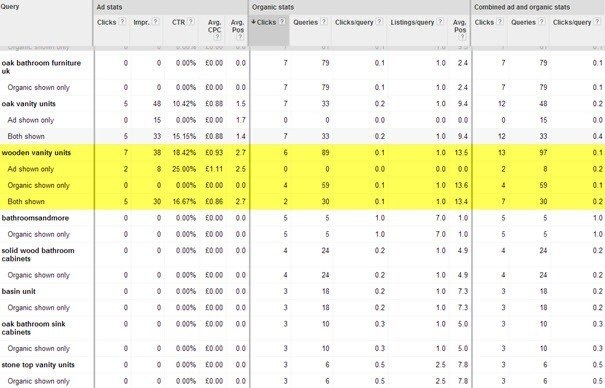
In the next example you can see that a PPC ad is appearing at the same time as the organic listing. You could test reducing your PPC bid to lower the average position and track whether this increases the traffic you receive for the keyword organically. This test works best if you have a paid search keyword and organic keyword appearing near the top of the search results.
Note: Organic data is not available historically so you will only see the data from the day that you link the two accounts. The impression data for organic searches will almost always be higher than the paid searches as with PPC, so you have to consider ad rank, impression share, budget etc.
How to find the report
Google AdWords > Campaign > Dimensions > View > Paid and Organic
Day 7 – Query Match Type
The final report I want to talk about is the Query Match Type report. You can find this report within Google Analytics, but it doesn’t report on all the metrics you really want to be looking at when analysing an AdWords campaign so I have created a Custom Report (link below) that does this.
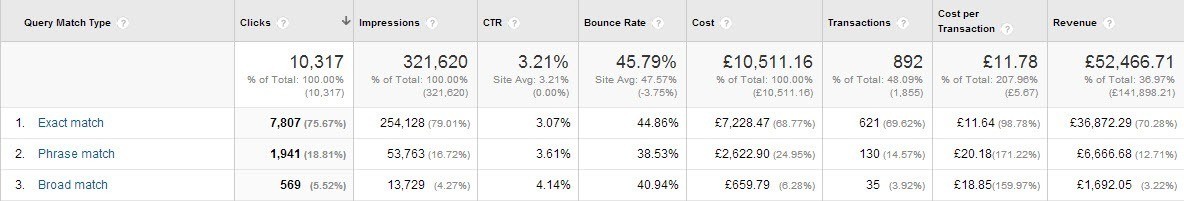
You often hear people say that broad match keywords tend to be cheaper than exact match and I do believe that in most cases, this is correct. However, I also hear that exact match keywords tend to convert better than broad match keywords, but I have seen a lot of campaigns that don’t fit with this trend.
Using the Query Match Type report you can see just how each match type is performing for you. I found using the standard report in Google Analytics that the data wasn’t worth much to me, but using the Custom Report, you can look at the match types for each individual campaign and see which are working best for you.
In some cases you may find that your broad match keywords are actually outperforming your exact and phrase match keywords. You can drill down further in the custom report by clicking on Exact, Phrase or Broad to see what keywords are responsible and pause those that don’t generate much revenue or drive a higher CTA.
How to find the report
Google Analytics > Acquisition > AdWords > Query Match Type
I have also set up a Custom Report that allows you to see a lot more data within the one report.
Summary
There are so many other reports that you should be running and analysing to make your PPC campaign better. I have only covered seven of them within this post but I urge you to spend time really getting to grips with everything that AdWords and Analytics have to offer.
I have recently filmed a video that looks at Paid Search Reporting and also presented at SES London in February this year on the subject too. The video and presentation slides can be found below.
Essential Paid Search Reporting Video
Paid Search Reporting and Analytics Presentation
If you’d like more information on PPC or to see how Koozai can help improve your campaigns, get in touch today.
Image Credit
Desk Calendar image Via Bigstock
Leave a Reply