 Crazy Egg is an Analytics tool, it’s a CRO tool, it’s an SEO tool, it’s a PPC tool. As much as it has been said before of other tools, I really think this is the Swiss Army knife of Digital Marketing tools and more than just a heat map. We use Crazy Egg at Koozai to help make sense of user conversion and engagement behaviour. We love it, so much so, we’ve put together this handy guide to using it.
The visualisation aspect of Crazy Egg is what makes it such a useful tool. With the aid of Crazy Egg Snapshots and the different methods of data visualisation, site owners can understand the context of data from the point of view of the user.
How Do You Implement Crazy Egg Tracking?
As a paid tool there are various subscription levels to suit different needs (as a friend of Koozai, click here for a free 90 day Crazy Egg trial). Once you’re a fully paid up egghead, you can implement the tracking code. To do this create your first Snapshot (going out on a limb I imagine this will be for your Home page) and unless you’re running a specific test or experiment I would set the end time to one year later (the furthest you can set it for).
Remember that one Snapshot is of one version of your page. So to track the desktop, mobile and tablet versions of your Home page you will need to create 3 Snapshots. Bare this in mind when selecting your package as you can burn through your Snapshot allowance quickly! Having created your first Snapshot you will be given some code to add to your site’s footer which will push the Crazy Egg tracking code out site wide. You can add the code before the closing <body> tag if you prefer to add the code on a page-by-page basis.
Crazy Egg Functions
As I mentioned before, Crazy Egg is more than just a heat mapping tool although the heat mapping function is certainly a big part of the options on offer. Here I run through these different functions.
Heatmap
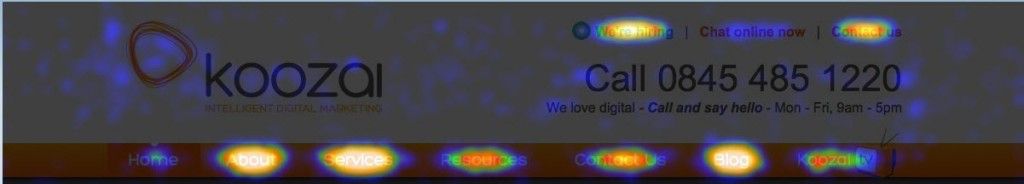
The Heatmap view renders a visualisation of your page with user click data overlaid. So you can see at a glance where people click on your page. Where the area is brighter, the greater the amount of clicks occurred. The converse is true meaning the darker areas indicate these are the less popular areas of your page for your audience.
Should you decided to A/B test two versions of a page or if you want to see the difference in interaction between two device types for the same page, you can use the Compare option to line up two Snapshots side-by-side. Equally you can select two entirely unrelated pages and compare their Snapshots to understand what elements of a page users are drawn to.
Filters are available to refine date ranges and exclude device types too. What Heat map allows you to do is understand the broad user trends making this a good tool for cascading top line information up the line. That said there will always be the call for more specific data such as number of clicks and referral source, for that there are the Confetti and Overlay reports.
Confetti
Moving into the Confetti function we can start to drill down to a lot more interesting user behaviour.

By making use of the drop down you can form an idea of user behaviour.
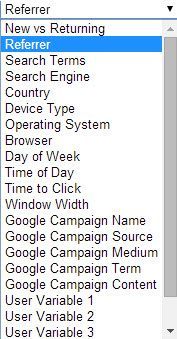
I tend to group them in the following sets in order to work within different contexts.
- Referrer
- Search Terms
- Search Engine
- New vs Returning
- Country
- Device Type
- Operating System
- Browser
- Day of Week
- Time of Day
- Time to Click
- Window Width
To use one filter to demonstrate its usefulness, even with the (not provided) purge eradicating much of our keyword data, using the Search Term option demonstrated that people coming to the site having used ‘digital marketing agency’ in the main, subsequently clicked on our Services pages. That’s a win as it confirms that the page’s content and layout is prompting the visitor to take the very step we want them to take.
For people using campaign tracking you can drill into that further with drop down options for:
- Google Campaign Name
- Google Campaign Source
- Google Campaign Medium
- Google Campaign Term
- Google Campaign Content
For advanced analytics implementations using custom variables you can segment the click data by specifying your variable:
- User Variable 1
- User Variable 2
- User Variable 3
- User Variable 4
- User Variable 5
Overlay
The Overlay function allows you to see the exact number of clicks each element received. Clicking on one of the crosses reveals specific click amounts and % share for the page. Brilliantly, the drop down featured above is included here for each link or click location. Again colour coding is in place from blue to red (low to high) so that at a glance you can gauge the popularity of a link/location.

Scrollmap
Scrollmap demonstrates the visibility of page content in its user’s browser. This is a vital tool in deciding where your key content should be positioned. Again using the low to high scale (this time blue to yellow), brighter areas reveal areas of a page that received the most impressions. Dark areas were viewed least. In the image below the lightest area surrounds the icons depicting each service on offer making it vital that these elements are clickable.
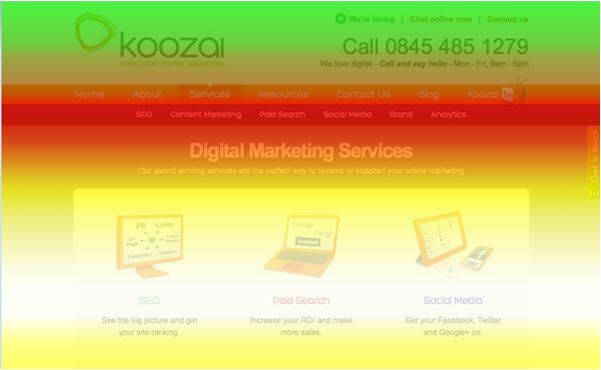
If you have pages using different column or lay out configurations, this is an excellent tool to enable the Compare function and see how visibility changes. You can begin to understand when a user will scroll and when they won’t. From this you can ensure your key messages are within the areas of your page that will gain the most attention. For example, it can help you answer whether your call-to-action is too low down the page.
List
The List function in one pop up/overlay pulls together click and % share of each element that was clicked whether visible to the Snapshot or not. This provides a handy overview of data.

Crazy Egg Insight
First of all, it’s worth noting that for reporting purposes PDF and JPEG exports are available to download should lifting screenshots not work for you.
How Much Data Do You Need?
Having a substantial data set is crucial as it can be easy to make knee jerk decisions from suspect data. Answering “how much data is enough data?” is tough to say as different sites get such differing visit volumes. It would be easy to say you need a minimum of a thousand or ten thousand visits, but I would take a leaf out of CRO best practice and look at what a typical sales cycle is for your company and collect data over a minimum of two complete sales cycles.
What Questions Can Crazy Egg Answer?
Having built up a picture of how users interact with your pages you can now answer some key questions:
What links do visitors click on from your core pages?
When visitors hit your page are they navigating in the way you expect them to or not? Do you need to be clearer about the next steps? Do you need to move the link, make the link bigger or change its colour?
What clickable assets aren’t clicked?
Why do you want people to leave the page for that asset? What value is it adding to your user’s visit? Have you conveyed it convincingly enough?
What un-clickable assets ARE clicked?!
Are your users telling you that that image needs to link to a page expanding on its subject? Or does that keyword surprise you with the amount of attempted clicks – if so do you have content to satisfy the user?
Is page layout configured in line with site usage?
Is your content buried in the wrong part of your page?
Are your ‘call-to-actions’ in the right part of the page?
Are your ‘Sign Up’, ‘Buy Now’ and ‘Contact Us’ button buried to far down your page? Do they stand out from your theme’s colour scheme?
The granular detail available specifically in the Confetti and Overlay functions can serve to aid your SEO, PPC and CRO work making Crazy Egg a must have tool for all commercial sites .
In A Nutshell…
Crazy Egg is easy to implement, easy to use and able to provide detailed insight to online marketers. Carrying out data led experiments in order to make data based decisions is now the standard for any Digital Marketer so having a tool that is flexible to your needs is becoming ever more vital.
Readers of the Koozai blog can take advantage of this great offer from Crazy Egg! Koozai’s fans and followers get 90 days free use of Crazy Egg
Leave a Reply