First of all, if you have never heard of Google Data Studio or you do not know what it is, I will explain …
Google Data Studio is one of the many tools offered by Google as part of the Google Marketing Platform. It’s a great, interactive dashboard and reporting tool. It works by connecting to your data sources and automatically pulls in the data, without you needing to manually refresh it. You can also pull in data from virtually any date range.
This can be done in real-time; meaning you will get the most up-to-date data possible. The simple to use interface also allows you to transform your data into appealing and informative reports and visuals for your audience.
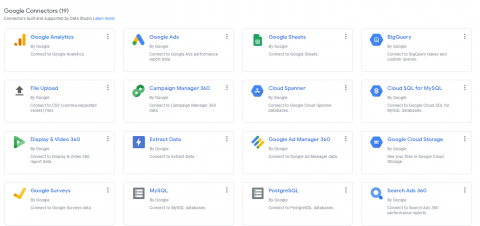
Data Studio has over 160 connectors that you can pull data in from. These connectors allow Data Studio to directly access your data and refresh it. We pull data into Data Studio from several sources including Google Analytics, Google Search Console, Google Ads, Google Sheets and BigQuery to name a few.
Here at Koozai we love using Google Data Studio to share interactive reports with our our clients. These reports provide our clients with clear and transparent reporting. They can look at the top-level stats or, if they want, delve deeper into the various aspects.
All our clients will have access to their own Data Studio Report with their important KPIs highlighted. Once we have created the first report for you, you will then be able to change some of the information on the report including the date you are viewing and see live data for the account.
Nothing is better than a report where you can interact with the visualisations. With Data Studio, we insert dynamic controls so clients can filter through the content with dimension and date range selectors. You will also be able to really drill down into your data by exploring data hierarchies.
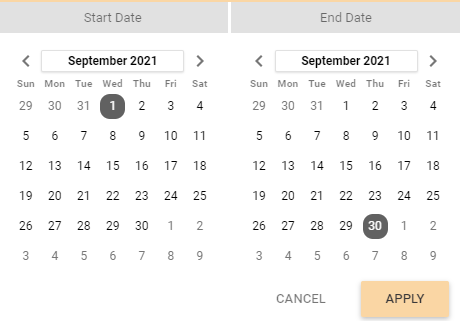
Drilling down gives clients a way to reveal additional levels of detail within a chart. For example, if you would like to see sessions by country, and sessions by city. Rather than include two charts in our report, we can include a single chart with drill-down enabled. By adding drill-down charts to the reports it makes them more interactive, reduces the number of separate charts required, and make it easier to find insights at various levels of detail in the data. Also, if you want to look at data for a set date range you can use the date-picker on the report pages, and when a client visits the online report, they can adjust the dates to view a different range.
By having a live data connection in our reports, it gives you the ability to toggle between date ranges. Depending on how far back your data goes, you can use any date range that you need to see data for. We include responsive chart filters in our report for example if a user highlights, December through to February on a time chart, the other charts on the page will show data for December through February as well.
Our reports become a living interactive document instead of a static report.
Sharing options are like Google Sheets or Docs where you have a unique shareable link as well as permissions settings. Once we send you the link you are then able to share the report with the rest of your team.
By utilising the above features this can help you build reports on the fly from our bespoke templates. This is ideal if you need to show results to the rest of the company or need to look at your data on the go.
If you need help with your Data Studio report, get in touch with a member of the Koozai team who will be happy to help.


Leave a Reply