
By now, you’ve probably heard about Google’s new ‘Core Web Vitals’ metrics they’re going to use the judge ‘page experience’ across the web.
If not, let’s have a brief recap…
In November 2020, Google announced that three new metrics would perform part of their algorithm from May 2021 onwards, these metrics are;
LCP (Largest Contentful Paint) – How quickly the largest visual element on your website pages loads
FID (First Input Delay) – How quickly the page son your website respond to user interactions
CLS (Cumulative Layout Shift) – How much the visual elements on your site shift around during loading.
You learn more about each core web vital metric here.
These metrics will form part of an overall page experience rating which includes other elements such as HTTPS and Mobile-Friendliness.
While these metrics may not be AS important as keyword-targeting, content and links, they could be the deciding factor between two pages that might otherwise be closely matched. Page experience can of course also influence conversion rate; pages that load and respond quickly are more likely to convert as outlined in this 2016 study by Google.
Ok, I’m sold, I want to check and fix more core web vitals, how do I do it?
There are a few different ways you can check your Core Web Vitals Using Google products, these are;
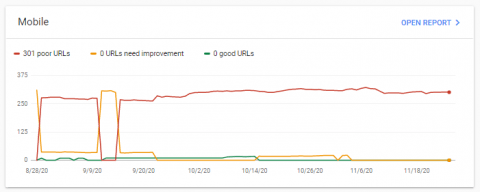
Google Search Console
You can get a broad overview of how many of your URLs are ‘poor’, ‘need improvement’ or ‘good’ from a CWV point of view for each individual metric within Search Console.
The issue with this is that it only gives a sample of your URLs, so you may not get data on some of your most important URLs.
Page Speed Insights
Probably the most well-known and widely-used tool for validating page load times is Google’s PSI tool.
This is more detailed than the Search Console Report but does not aggregate pages to buckets of ‘good’ and ‘bad’. This means it’s good for getting a more forensic insight into a particular page.
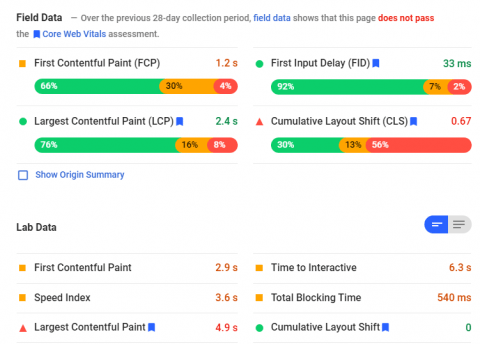
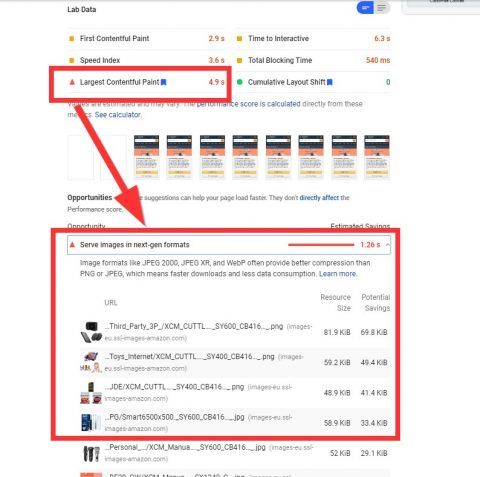
These are performance metrics for the Amazon UK homepage.
Note that there are two sections; field data and lab data – field data is an aggregate score based on the CrUX (Chrome User Experience Report) over the last 28 days i.e. real-world data from actual Chrome users. Lab data is based on real-time data; i.e. the test that you run there and then in the PSI tool.
Also note that the ‘FID’ CWV metric does not appear in the lab data – this is because there is no user interaction to gauge, whereas there will be in the CrUX report. In the Lab Data, this is replaced by TBT (Total Blocking Time) which is a close equivalent.
Lighthouse
Lighthouse can be used within Chrome Dev Tools, or as a Chrome browser plugin, offering yet another avenue into CWVs.
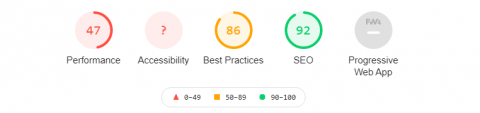
Lighthouse offers a more ‘holistic’ (I hate that word too) view of web performance, taking into account other factors aside from Performance such as ‘accessibility’ and ‘best practices’. The performance analysis and suggestions are very similar to PSI, so it doesn’t matter too much which one you use.
Fixing Core Web Vitals Issues with Google Tools
With all this in mind, I’d recommend using Google Search Console to get an overview of your URLs that are in most need of improvement.
Once you know this, you can use either Lighthouse or PSI to assess individual pages. Regardless of whether you choose to use Lighthouse or PSI, a great overlooked tip is to look at the scoring calculator – here you can see what percentage of each CWV (along with other metrics) makes up of the total performance score
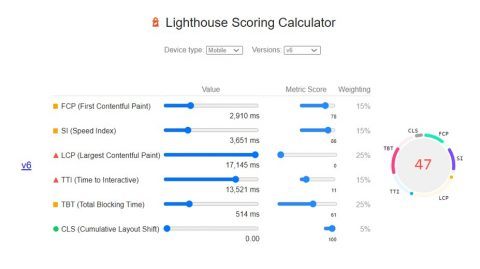
From this, we can quite easily see that the biggest opportunity lies in improving the Largest Contentful Paint Time given it scores 0/100 and makes up 25% of the overall performance score.
From there, if we navigate back to the main screen we can see where the main opportunities lie
The issue is, with PSI, we know what we need to fix and what will drive the biggest impact but we don’t necessarily know which issue corresponds to which CWV, so we can’t hone in on LCP with absolute certainty.
Enter GT Metrix…
Auditing and Fixing with GT Metrix
The first thing to mention about GT Metrix is that it’s a 3rd party tool, so it doesn’t use Google data. Given that you want your website to appear as high as possible in Google, you should probably pay most attention to what they say about your site, but other tools can shine a light on areas of page performance that Google may not.
If we run a report on amazon.co.uk in GT Metrix, we can see the Web Vitals listed here;
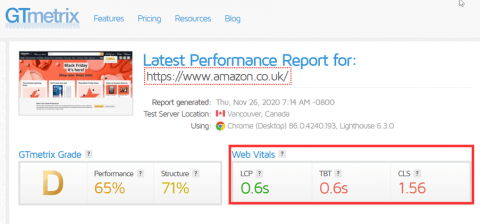
Notice that the LCP time does not match what PSI says – this because the GT Metrix score is essentially ‘lab data’, so based on real-time data which will be affected by many different factors (including the server location – we can see that GT Metrix operates from Vancouver).
Whether we should put more stock in PSI or GT Metrix data is up for debate – the most representative source of data is arguably the field data, since it contains a much larger sample of users over a longer time period. Having said that, if changes to the site/pages on the site have occurred very recently which affect the performance score and CWVs (either positive or negatively), this may not be reflected in the Filed data.
The right answer is that you should probably pay attention to both – perhaps prioritizing Field data if you’re certain that no changes have happened in the past month.
Where GT Metrix excels over Google’s tools is the reporting and suggested fixes for CLS issues
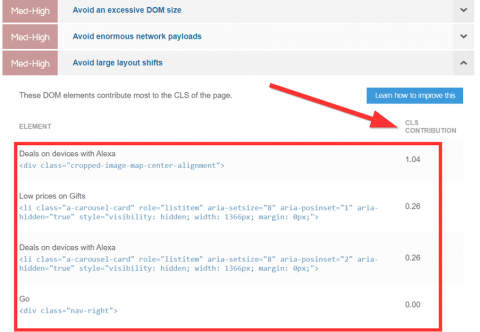
As you can see, GT Metrix offer solutions for performance issues just like Google PSI and Lighthouse, but unlike Google’s tools, GT Metrix specifically outlines which issues are affecting CLS and to what degree.
For example, above we can see the exact elements that are contributing the high (bad) CLS score
When we inspect the site, we can see that three of these elements are within the carousel
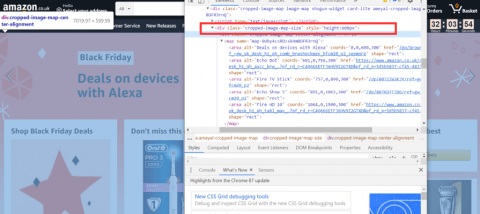
(we probably could have deduced that without even inspecting).
Of course, a carousel will contribute to the layout shift of a page because it auto-scrolls.
Does that mean all carousels are bad for CLS and therefore overall SEO performance? That’s a topic for another day – but I doubt Jeff Bezos is too concerned about his CLS score (or maybe he is…).
The main point here is that GT Metrix is excellent for diagnosing CLS issues.
What’s Better; Lighthouse, PSI or GT Metrix?
There’s no right answer to this question, each tool has its own purpose and ideal use cases.
As mentioned, Lighthouse and PSI produce the same metrics/scores when it comes to performance- if anything Lighthouse is a little more succinct given that it can be deployed from a browser plugin.
While Search Console can be used to give you an aggregated view, Screaming Frog does a much better of giving a comprehensive view of all the pages on your site using the Page Speed Insights API.
Once you have data on which pages are sub-optimal you can go about assessing individual pages using Lighthouse or GT Metrix.
For any page with CLS issues, I’d use GT Metrix since it’s currently much better at highlighting specific elements that are causing the issues.
Overall though, I’d ensure you’re using a few different tools to get the best possible picture of what’s going on, and be aware of the differences between Lab and Field data.


Leave a Reply