
I thought it would be a good idea to put together a blog on an overview of the explore section in GA4 and some of the features in the explore section as I tried searching for info on it and there wasn’t much out there.
GA4 is radically different to Universal Analytics (UA). You need the explore section in GA4 to dig deeper into data as lots of the reports from UA are not in GA4. The explore section has been designed to help you understand your data better.
Let’s start with the basics of the explore section in GA4
The explore section is what you use to explore data in GA4. Think of it as building a story of the results and the traffic. By using explore reports you are listening to the data and then can forecast your results and optimise your website.
Set up of explore reports
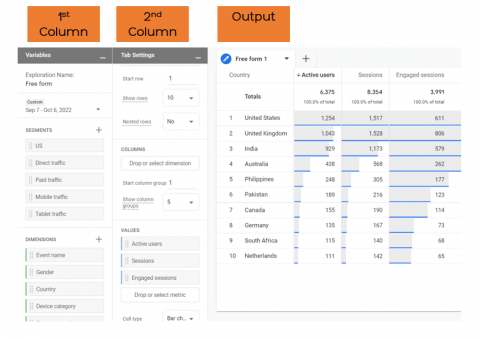
Every explore report has the same basic set-up…
1st column – is called variables. You can change the name of the report, date range, segments, dimensions and metrics. The dimensions and metrics must be added to this column before you can add them to the 2nd column.
2nd column – is called tab settings. Depending on what technique you select means the other fields will change. You can then drag and drop the variables from the 1st column to the 2nd column or you can double-click on the variables in the 1st column to move them to the 2nd column.
Output – the right-hand side of the screen is the output (report generated).
What are dimensions and metrics
Every report in is made up of dimensions and metrics. It can be confusing to get your head around the difference between dimensions and metrics.
A dimension is a descriptive attribute or characteristic of an object that can be given different values. I like to think of it that dimensions are who, what or where.
Metrics are individual elements of a dimension that can be measured as a sum or a ratio. They are quantitative measurements.
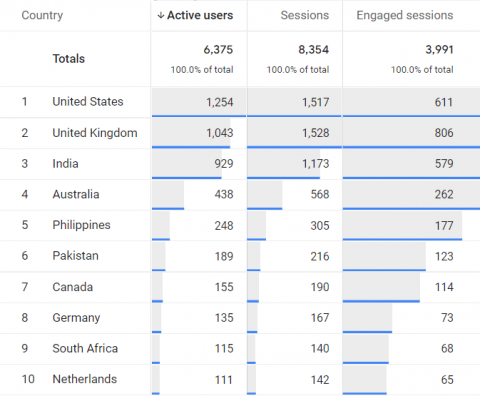
In the below example dimensions is the country and metrics are the active users, sessions and engaged users.
Different types of reports in the explore section
You will find numerous reports and templates in the explore section. Make sure you keep going back and checking the template gallery as new templates are always being added.
Below I have listed a brief explanation of the different reports.
Free Form – you can create custom charts and tables – this is like the traditional explorer report that is in UA.
Funnel Exploration – you can measure all events into a funnel. Everything in GA4 is an event. This report is great as you can build a report on historic data which UA couldn’t do. You will love this report if you have an ecommerce site.
Path Exploration – this is like the goal flow report in UA to break down different paths people are going through.
Segment Overlap – you can compare user segments and see how they overlap with whatever breakdown of data you choose.
Cohort Exploration – this is like the cohort reports in UA. You can break out certain groups depending on how you have set up GA4. It is good because you can see behavioural analytics in which you can group your users based on their shared traits to better track and understand their actions.
User Explorer – this allows you to see data at a user level. It was in UA but in GA4 you can really customise it and add segments, different metrics and dimensions. Device ID and Stream Name are required and are the only dimensions possible. However, you can change the metrics by adding or removing them in the values section of the tab settings column.
User lifetime – this allows you to analyse the entire lifetime of your users. This sounds great but be warned it can only be as good as the data it gets.
Hope you found the above overview useful. The best thing you can do to learn GA4 is to start building explore reports and see what interesting data it shows.


Leave a Reply