
We love digital 0330 353 0300

Google Analytics has become a ‘heads up’ of sorts, giving me a nudge to get to the bottom of any anomaly and as a result it is the first thing I open each morning. Such is its importance to me now, it is now my ‘go to’ if I need to get a feel for a multitude of digital marketing elements be it SEO indicators, sales performance or site health.
So in this post I’m going to share dashboards, custom reports and advanced segments to help you beef up your site analysis. These are by no means the be all and end all, simply what I’ve built up over time and use reasonably frequently. In the main they have come from 3 main sources:
I do scour other sources and am keen to find more so let me know any people or sites that deserve a shout out in the comments section below.
AdWords itself gives a wealth of Insight for day to day PPC management from the AdWords console, but I’ve found these give extra value to my AdWords analysis.
From one of the Google Analytics team, this report summarises the key AdWords metrics nicely, allowing you to understand the big picture (but bear in mind the difference in click attribution AdWords and Analytics use).
These nifty Advanced Segments, again from the Google Analytics Solutions library, add a useful means of analysing paid search by separating out your top performers by Top Slot and Right Hand positions This is an excellent way to clarify if you need to be paying top dollar for ad position or if you simply just need to be seen.
To get started looking at what organic traffic is giving your site, this overview Dashboard originally shared by Anna Lewis, will give you an organic view of sources, landing pages, cities and even a smidge of keyword data whilst it still exists.
Customreportsharing.com is an excellent resource if you’re looking to augment your analytics resources. I particularly like this custom report as it’s useful for analysing the value your content marketing efforts are contributing.
Or for a simpler report simply showing sites driving traffic to your site, install this custom report for Google Analytics.
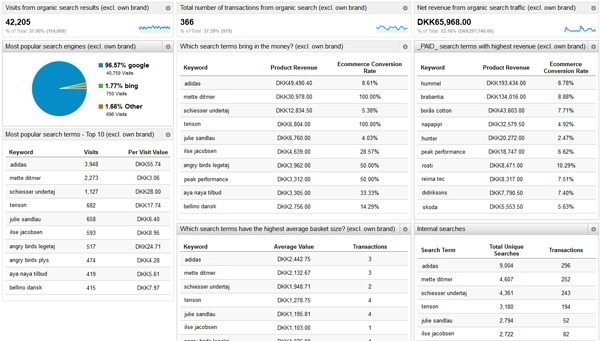
Dashboardjunkie.com has a wealth of useful stuff and one of my favourites is this ecommerce Dashboard that zero’s in on what is being delivered by your SEO efforts. It gives you visit data, source and keyword analysis and combines this with revenue data.
So unless 1 Rock, Rock Street is where you’ve been living for the past few months, you’ll be well aware of Google moving to 100% secure search and the taking away of OUR keyword data. Ok, rant over.
Dan Barker, like many saw this coming and pushed live https://notprovidedkit.com/ more or less as soon as the pixel ink had dried on the announcement from Google. Dan’s kit of GA add ons covers Dashboards, Custom Reports and Advanced Segments to help you analyse what data you have left as well as crack a bit of something useful out of (not provided).
Get yourself over to Notprovidedkit.com and stuff your Google Analytics account with lots of goodies.
Dashboard: Site Performance
For an overview on a site’s performance this Dashboard provides a useful top level view of any site that can help you narrow down which factors need improving. From Customreportsharing.com, this Dashboard looks at page load time and how it is impacted by various factors from browser to location.
Custom Report: Visit By Hour of Day
Getting to know your average user will help inform your style of content, when best to set new content live and when to distribute it for the optimimum impact.
Here you can view how users interact with your site in 3 key areas over the course of the day:
Dashboard: Basic Visitor Facts
Dashboardjunkie.com has two excellent Dashboards that drill down to some insightful user data. One at looks at basic facts about your site visitors such as; location and technology (ie; browser, screen resolution and device type).
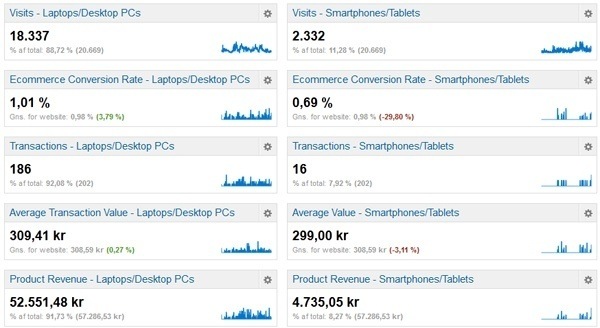
Dashboard: Mobile vs Non-Mobile Visitors
The second helpful Dashboard helps you compare and contrast between mobile and non-mobile users of your site.
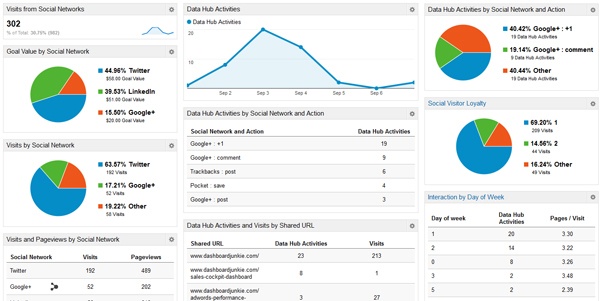
Dashboard: Social Media Dashboard
Everybody’s favourite buzzword and a bit of a nightmare to attribute value to. Each organisation will have its own expectation of the role Social Media should play and this custom report from Dashboardjunkie.com will give you the following top line insights:
So that is a grand total of 13 Google Analytics add ons to help you identify factors that can help improve your web analytics efforts. There are countless others so let me know what you like to use and if there are any that you may have designed that are worth covering.
If you would like advice on utilising Google Analytics dashboards or more information on our Google Analytics services, please do not hesitate to get in touch.
Image Credit
Web Analytics Doodle Elements via BigStock


